A friend of mine — a sharp content marketer who’d been at it for nearly three years — reached out frustrated last winter. He’d built out an entire 40-article content calendar, published consistently, and optimized every meta tag by the book. Twelve months later? His organic traffic was basically a flatline. When we sat down and audited his strategy, the problem was painfully obvious: every single keyword he was targeting was chosen by search volume alone. No intent analysis. No topical authority mapping. Just big numbers on a spreadsheet. Sound familiar?
That story isn’t unusual. In fact, it’s the default trap most bloggers and SEO beginners fall into — and in 2026, it’s become even more costly to make that mistake. Let’s unpack why, and what actually works right now.

Why Volume-First Keyword Research Is a 2019 Relic
Volume-first keyword research is a 2019 strategy. In 2026, Google’s AI algorithms, AI Overview dominance, and zero-click search behavior mean that chasing high-volume keywords without matching intent produces traffic that converts to nothing — or no traffic at all.
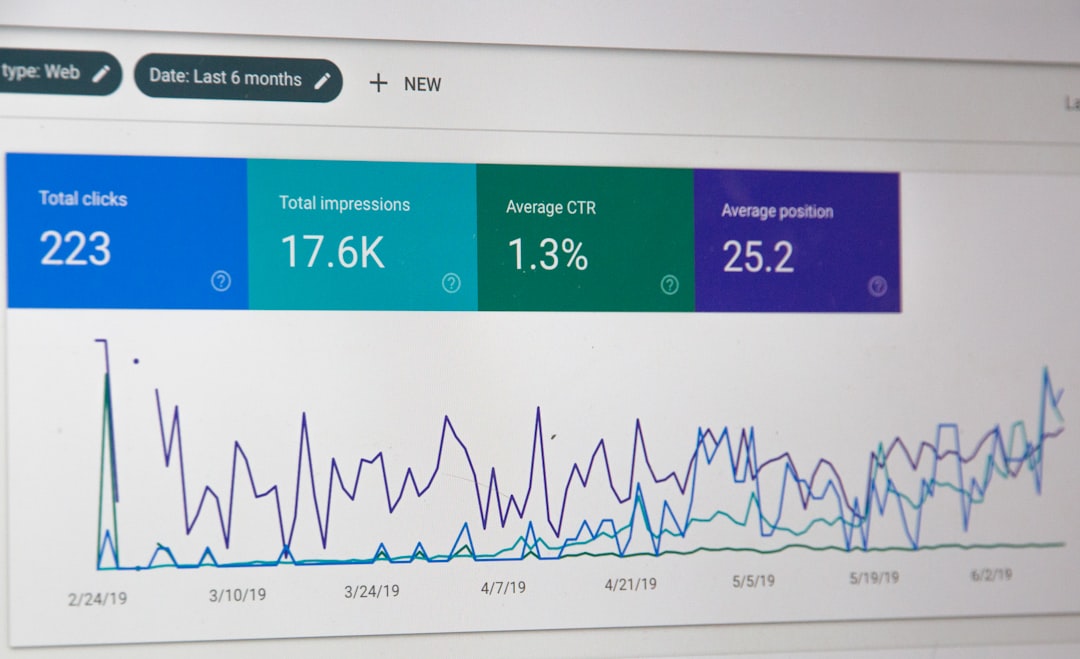
Here’s a number that should stop you in your tracks: with 58.5% of searches now resulting in zero clicks, understanding search intent has become more important than chasing volume. Think about what that means — over half the people searching for a topic never even click a result. They get their answer from the SERP itself, whether from AI Overviews, featured snippets, or knowledge panels.
Keyword research has fundamentally shifted from volume-first to intent-first methodology. With 91.8% of all searches being long-tail keywords, and AI search platforms accounting for growing search share, successful 2026 keyword research must serve two purposes: ranking in traditional search results and being cited in AI-generated answers.
The business case for getting this right is massive. B2B companies using strategic keyword research achieve 702–1,389% ROI from SEO according to First Page Sage research. But the flip side? Basic content marketing without proper keyword research delivers only 16% ROI over three years. That’s the difference between a growth engine and a content graveyard.
The Intent-First Framework: What It Actually Looks Like
Keyword research in 2026 means identifying the exact questions, problems, and decisions your target audience is searching for, then matching your content to the intent behind each search — not just the words used.
In 2026, search engines weigh relevance and user satisfaction heavily, so choosing the right keywords ensures your content aligns with what real people are looking for. AI-driven ranking systems also evaluate context, meaning your keyword strategy should focus on clarity, precision, and intent rather than stuffing or repetition.
One of the most common and costly errors? Writing informational content for transactional keywords, or creating service pages for informational queries. The match between intent and content format is more important than keyword density.
Here’s the five-phase workflow that’s producing results right now, according to multiple SEO practitioners:
- Phase 1 — Seed Keyword Generation: Before opening any keyword tool, write down the 10–20 most common questions your customers ask before hiring you or buying from you. These are your seed keywords. Real customer language is almost always better than industry jargon.
- Phase 2 — Volume & Difficulty Assessment: Keyword Difficulty (KD) indicates ranking challenge. Lower KD equates to more accessible targets. Beginners should focus on terms scoring below 30.
- Phase 3 — Intent Mapping: Begin with real audience questions, problems, and goals. Prioritize terms with informational or navigational intent first, then map transactional terms to product pages or checkout paths.
- Phase 4 — Topic Clustering: Gather 10–20 seed phrases per core topic, including long tails. Group related terms into topic clusters and label each with a halo topic.
- Phase 5 — Editorial Calendar Build: Keyword research remains the compass for aligning content with real demand, reducing wasted effort and driving qualified traffic. The top-performing pages blend precise terms with practical value. Topics rooted in intent, seasonality, and user needs outperform generic optimization.
Long-Tail Keywords: Your Underrated Growth Lever
Long-tail keywords are essential for SEO in 2026 because they target highly specific queries. Instead of broad terms with heavy competition, long-tail keywords attract users who already know what they want. These keywords often lead to more focused engagement and better conversion opportunities.
Long-tail keywords are specific phrases (3+ words) with lower volume but higher conversion rates. Research shows 91.8% of searches are long-tail, and they convert at 2.5 times the rate of short-tail terms. That’s not a marginal advantage — that’s the ballgame.
Also worth remembering: many valuable B2B queries don’t register in keyword tools because search volume is too low — but they represent high-intent buyers. Terms like “HubSpot onboarding agency London” may show zero volume yet drive qualified pipeline.

The Right Tools for 2026 (And One You Should Avoid)
Use Google Keyword Planner, Semrush, Ahrefs, or similar tools to expand your seed keywords. But don’t stop there — searches on TikTok, YouTube, Instagram, and Reddit reveal how your audience actually phrases their questions. These social search queries often translate directly to blog and content opportunities.
Here’s a tool-selection breakdown that works regardless of your budget:
- Google Search Console (Free): Shows you what people have searched when your site appears in the results — and yes, this includes AI Overviews / AI Mode queries, too.
- AlsoAsked (Freemium): One of the best question-finding tools — just type in a keyword or trend and get a graph of all the related questions people are asking about the subject.
- Semrush / Ahrefs / SE Ranking (Paid): Stick with trusted SEO platforms like Semrush, Ahrefs, or SE Ranking for accurate keyword difficulty and volume data.
- AnswerThePublic + People Also Ask: Tools like AnswerThePublic, Google’s “People Also Ask,” and SEMrush’s Keyword Magic Tool help reveal long-tail variations related to your core topic.
One major warning: don’t ask ChatGPT to give you blog keywords — it’ll lie to you. The data is never accurate in terms of how popular or difficult a particular keyword is. I’ve seen this mistake kill otherwise solid SEO strategies.
How Often Should You Revisit Your Keyword Strategy?
Review keyword strategy quarterly for most businesses. Search behaviour, competitor positioning, and AI search patterns evolve continuously. Annual keyword research is insufficient given the pace of change in 2026.
If you’re in a fast-moving vertical — SaaS, fintech, AI tools — monthly monitoring is the safer bet. AI search behavior changes rapidly enough in 2026 that annual keyword audits are no longer sufficient.
What About Keyword Cannibalization?
This one quietly kills rankings for a lot of sites. Keyword cannibalization is when multiple pages on your site target the same primary keyword, causing them to compete against each other. This splits authority and often causes neither page to rank well. Each primary keyword should map to one canonical page.
If your site has been publishing for more than a year, run a cannibalization audit before building any new keyword clusters. Tools like Ahrefs’ Site Audit or Semrush’s Position Tracking will surface these conflicts quickly.
The Bottom Line: Right Keyword + Right Intent = Real Traffic
If you want to rank on Google in 2026, everything starts with keyword research. Without the right keywords, even the best content won’t bring traffic. But “the right keywords” no longer just means the highest-volume terms — it means the terms with the clearest intent match to what you’re actually offering.
If you’re just starting out, keep it simple: emerging sites benefit by concentrating on long-tail keywords. These phrases are longer, more specific, and present reduced competition. Win the small battles first, build topical authority, then go after the bigger terms as your domain grows.
And if you’re an established site that’s plateaued? Stop adding more content and start auditing what you already have. Map intent, merge cannibalizing pages, and prune thin content. The algorithm rewards depth over breadth.
💬 Drop a comment below: What’s your biggest keyword research struggle right now — finding low-competition terms, matching intent, or keeping up with AI search changes? Let’s troubleshoot it together.
📚 관련된 다른 글도 읽어 보세요
- I Wasted 6 Months Chasing Volume — The 2026 Keyword Research Method That Actually Works
- Layer 2 Blockchain Scalability in 2026: The Engineer’s Deep Dive into Rollups, ZK Proofs, and the Race to 100K TPS
- 아직도 감으로 키워드 찾아요? 2026년 기준 SEO 키워드 리서치 실전 세팅법
태그: []